Hi,
I'm Cameron W.J. Abrams
Software Engineer ,
Applied Mathematician, &
J.D. Candidate
Contact
About

A Little About Myself
I graduated from UC Berkeley in 2017 earning a bachelors in applied math with a focus in computer science. Since February of 2018 I've been working as a software engineer at Mercury Insurance. I completed my masters degree in Applied Math at CSU, Fullerton in December 2020. In Fall 2022 I started the evening J.D. program at Loyola Law School in Los Angeles. In my free time when I'm not hanging out with my wife, daughter, and our dog Chua I'm working towards my J.D. degree, reading Malazan Book of the Fallen, or learning to play the violin.
Skills
Profesional Skills

Projects
COVID-19
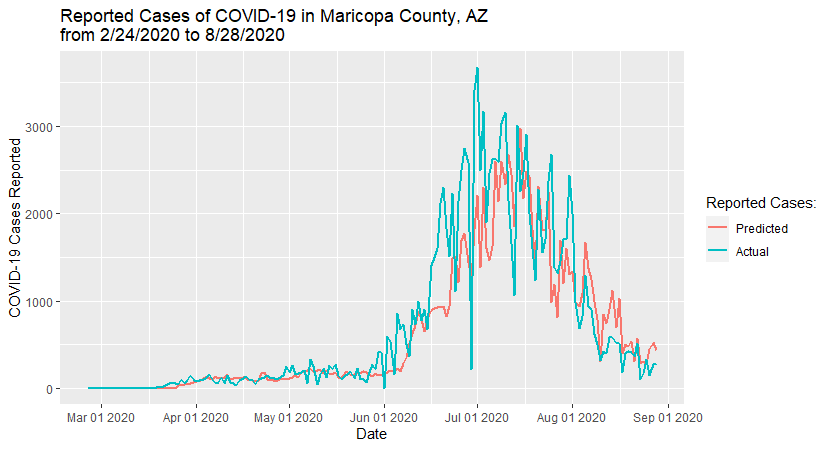
I initiated and worked on original research at CSU Fullerton. I collected COVID-19 case and death information, as well as mobility data from Google and Apple for over 100 U.S. counties. I then used the data set to build numerous predictive models. We used neural network, ridge regression, and lasso models to predict both new cases and mortality on any given day. I also used the data to predict, based on mobility behavior and number of new cases/deaths, which county the data represented using LDA, QDA, multinomial regression, and neural networks. Below is a graph depicting the actual reported cases in Maricopa county during 2020. Along side the actual cases you can see the predictions made for the same days. The predictions for each day are made using only data from the 7 day period ending 2 days previously.

LUNAR LANDING 2024
Served as team leader on an industrial project for NASA JPL as part of completing my Masters. We created a MATLAB GUI application which performs coverage analysis and terrain visualization of the Lunar South Pole. Here's a short demo displaying the Lunar South Pole over the course of a month. Red represents Sun illumination, blue represents Earth visibility, and purple is their intersection.
COVID-19 Orange County Data
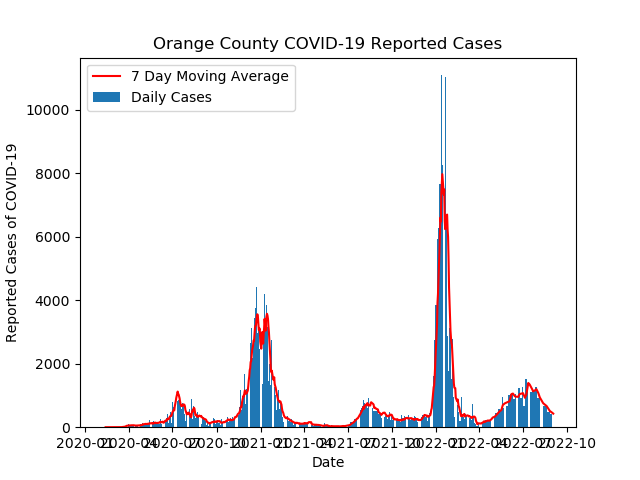
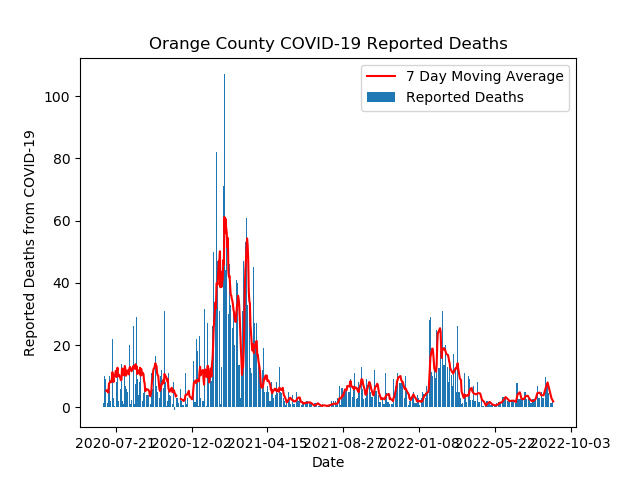
[Project discontinued but data is still available.] The following data was collected from https://occovid19.ochealthinfo.com/coronavirus-in-oc during the course of the pandemic and is updated daily. Sometime during Summer of 2020 I noticed that I could no longer easily download the complete history of COVID-19 data and the county was only posting daily figures. I decided to try to recreate some of the graphs they originally had as well as offer the complete history as an easy single-click download. Certain dates are missing or are repeated. Repeated dates should have the same associated data, if not, please feel free to let me know.


Resume
Work
